My Blog's Performance Before and After CloudFlare
Published November 22, 2012
This article was published a really long time ago.
Its value then was likely questionable. Its value now is certainly pure nostalgia.
CloudFlare is a service that offers the benefits of a CDN with some automatic optimisation and security features chucked in. In this post I'm going to show the difference in load times of my blog before and after using CloudFlare. I'll do this using a few popular tools for measuring web performance, Google PageSpeed Insights, Pingdom Tools and YSlow.
It's important to note that I didn't do any optimisation prior to CloudFlare, no code minimisation, compression, sprites or minimising of requests. Nothing what-so-ever. If I had, we can probably safely assume my before scores may be higher. But it's also possible this optimisation could lead to higher 'after' scores, as well.
Before CloudFlare
Google PageSpeed Insights
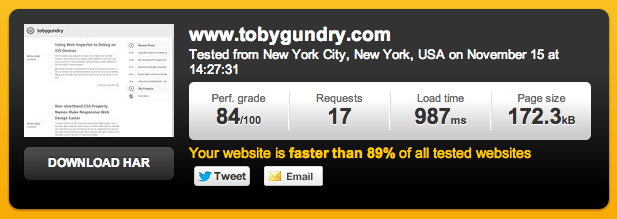
Pingdom Tools
YSlow
After CloudFlare
Google PageSpeed Insights
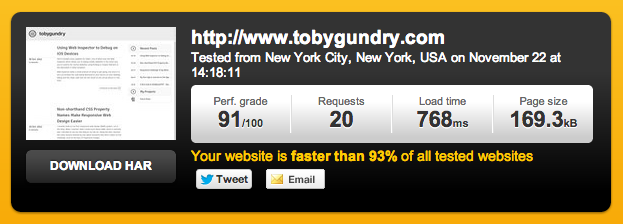
Pingdom Tools
YSlow
So as expected there's a notable increase in my performance scores across all the performance measurement tools I used. An averaged 10.6 point increase across the 3 tools (13 point jump for Google PageSpeed Insights, 7 points for Pingdom Tools and 12 points for YSlow.)
Google has a similar service in beta called Google PageSpeed Service, which seems to have a very similar offering to CloudFlare. When I have access to PageSpeed Service I'll re-test both services and post my results.
I see this kind of service becoming common place on the web. Ignoring all the other benefits for a moment, the code minimisation features alone make for a much smoother deployment process (providing you're willing to trust the service to do this for you), now instead of making changes, then running your code through a minimiser, you can just deploy.
If you want to try CloudFlare out on your own site, you can get a free account at http://www.cloudflare.com


