Using Web Inspector to Debug on iOS Devices
Published October 30, 2012
This article was published a really long time ago.
Its value then was likely questionable. Its value now is certainly pure nostalgia.
iOS 6 included many updates for Safari, one of which was the Web Inspector which allows you to debug mobile websites in the same way you're used to for normal websites using Firebug or Inspect Element or the equivalent in other browsers.
Web Inspector takes a small amount of setup to get going, but once it is you can browse the code being delivered to your device on your desktop, debug and hot swap code and see the result on the actual device in real time.
Setup Web Inspector<
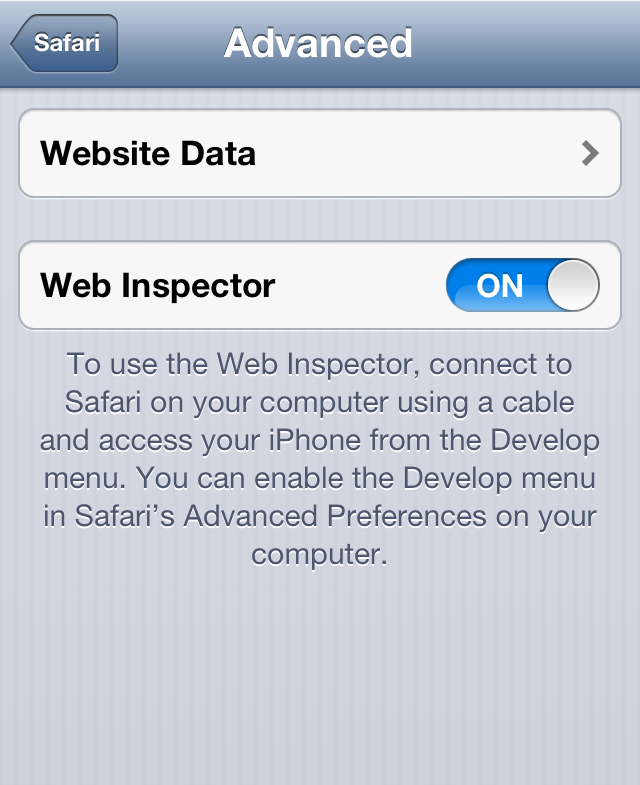
1. Enable Web Inspector on your iOS Device
[Settings] -> [Safari] -> [Advanced] -> [Web Inspector] switch to on
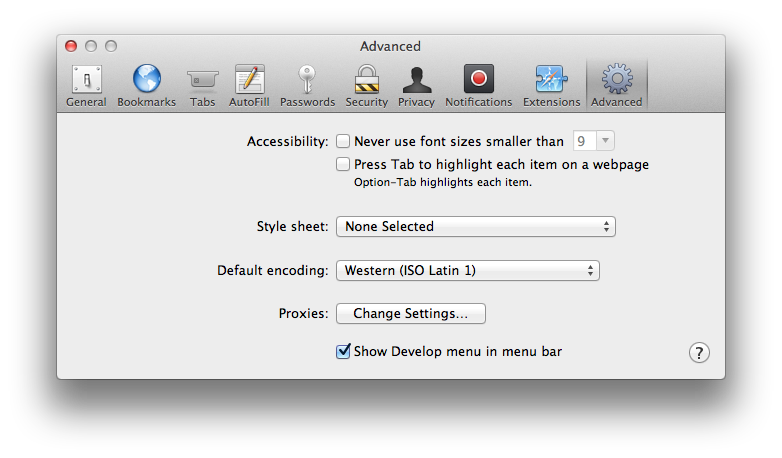
2. Enable 'Develop' menu in Safari on your desktop
From Safari [Safari] -> [Preferences] -> [Advanced Tab] -> Tick 'Show Develop menu in menu bar'
3. Connect your iOS device
Connect your iOS device to the desktop using the data cable.
Using Web Inspector
1. Open the site in Safari on the device
Open the site you want to debug with Web Inspector in Safari on your device and leave it open.

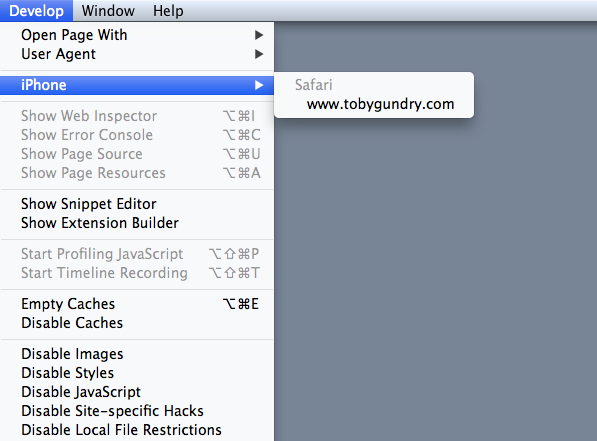
2. Open the Web Inspector on the Desktop
From Safari [Develop] -> [iPhone] -> Choose the site you just opened
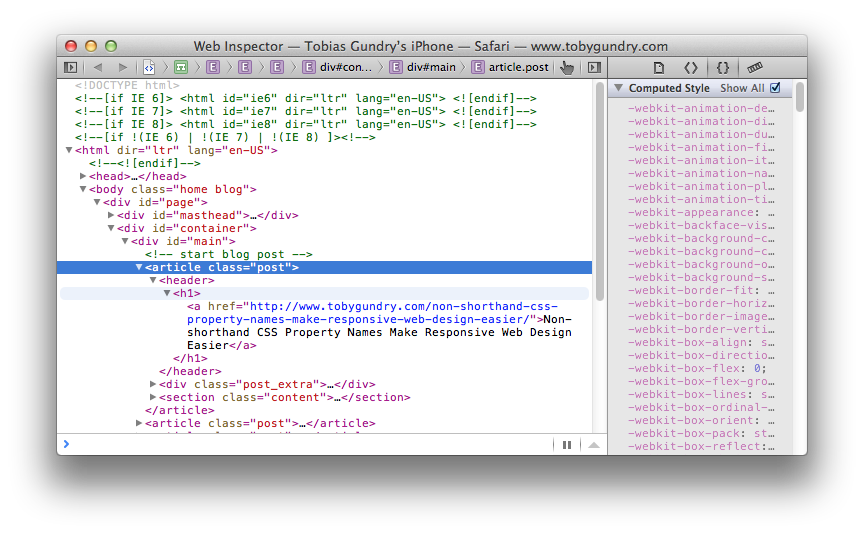
3. Debug
Now you can see the source for the site loaded on the device on your desktop and hover over markup and see the rendered content highlighted on the device screen...
Now you can debug your web code on your iOS device as you're used to for the desktop - seeing changes you make on the actual device in real time.
